Cultural Analysis based on Foursquare Checkins
Released in January 2014
During my studies in Telecom SudParis, I had the chance of working on a project with Big Data.
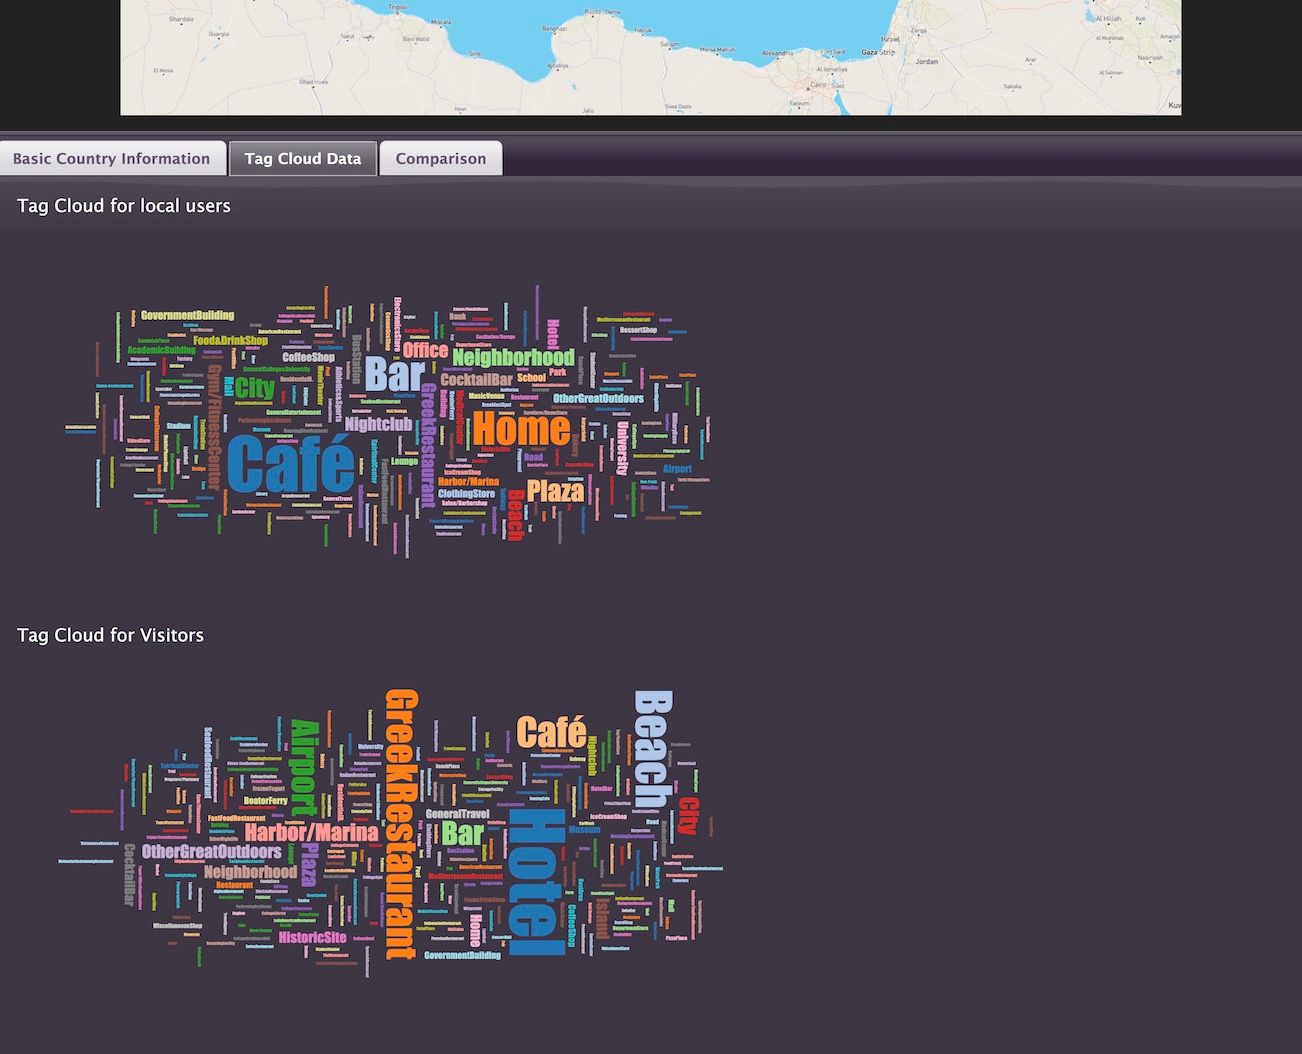
The idea was to process 32GB of raw compressed data retrieved by Foursquare about anonymous users checkins. Based on the geographic location and the type of the checkin (the venue type), data about the habits of the Country's peoples could be drawn.
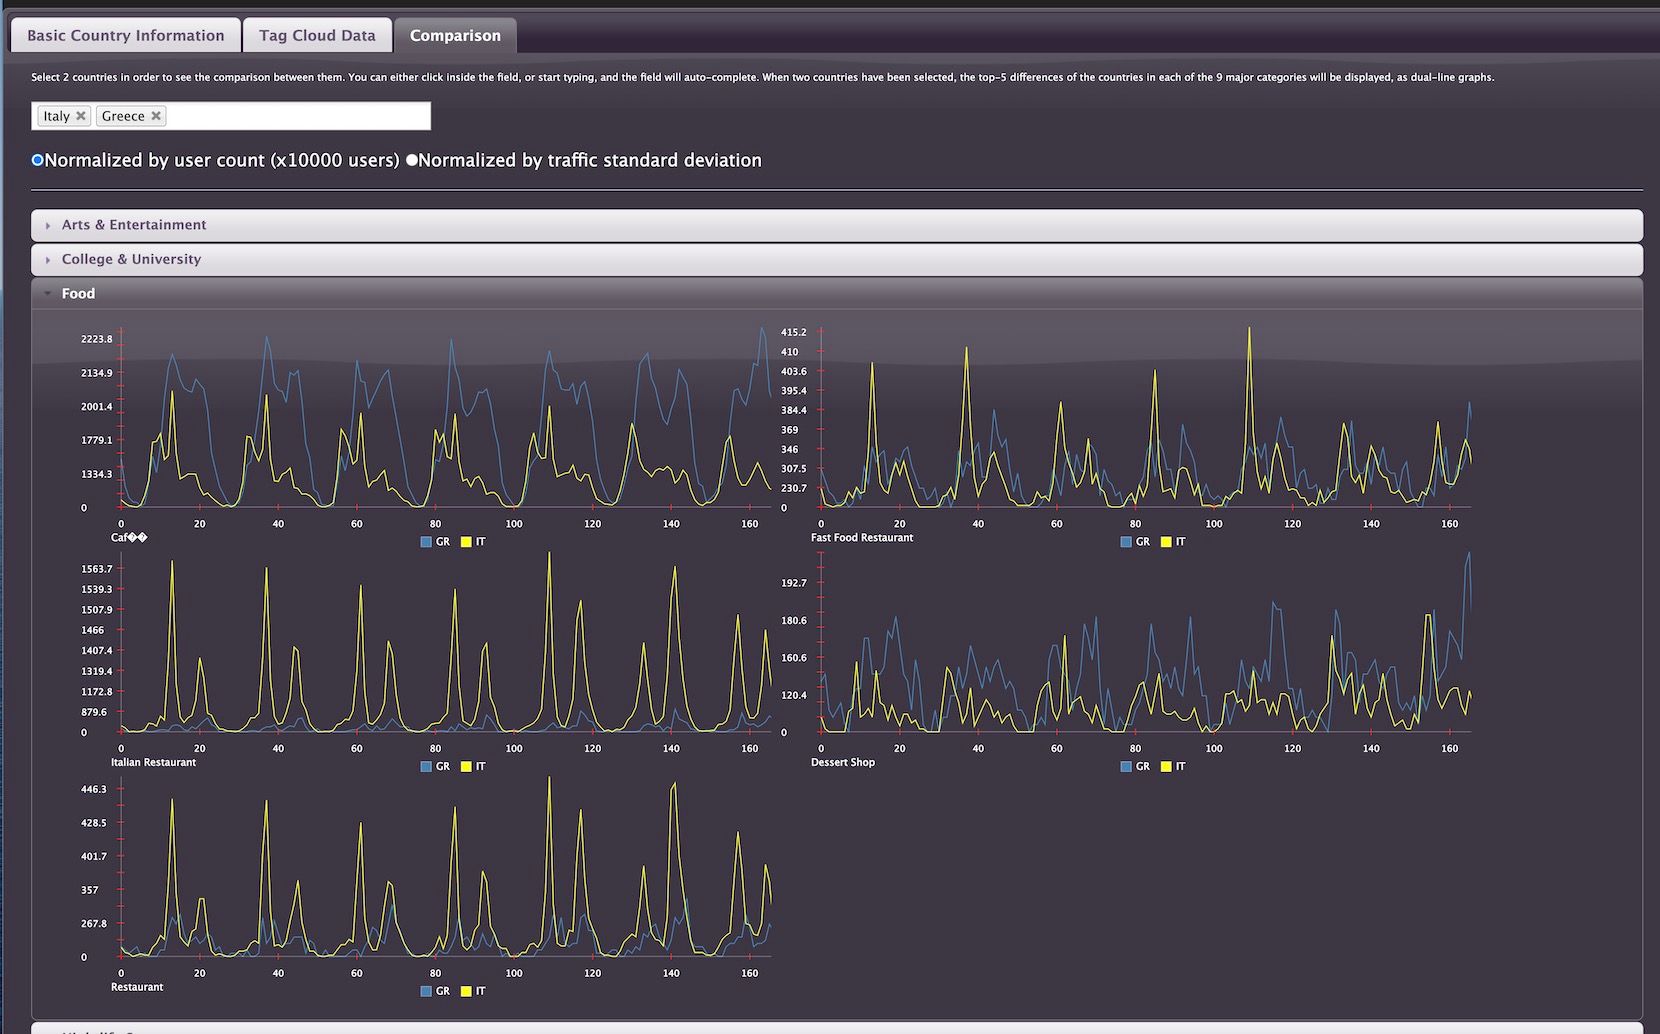
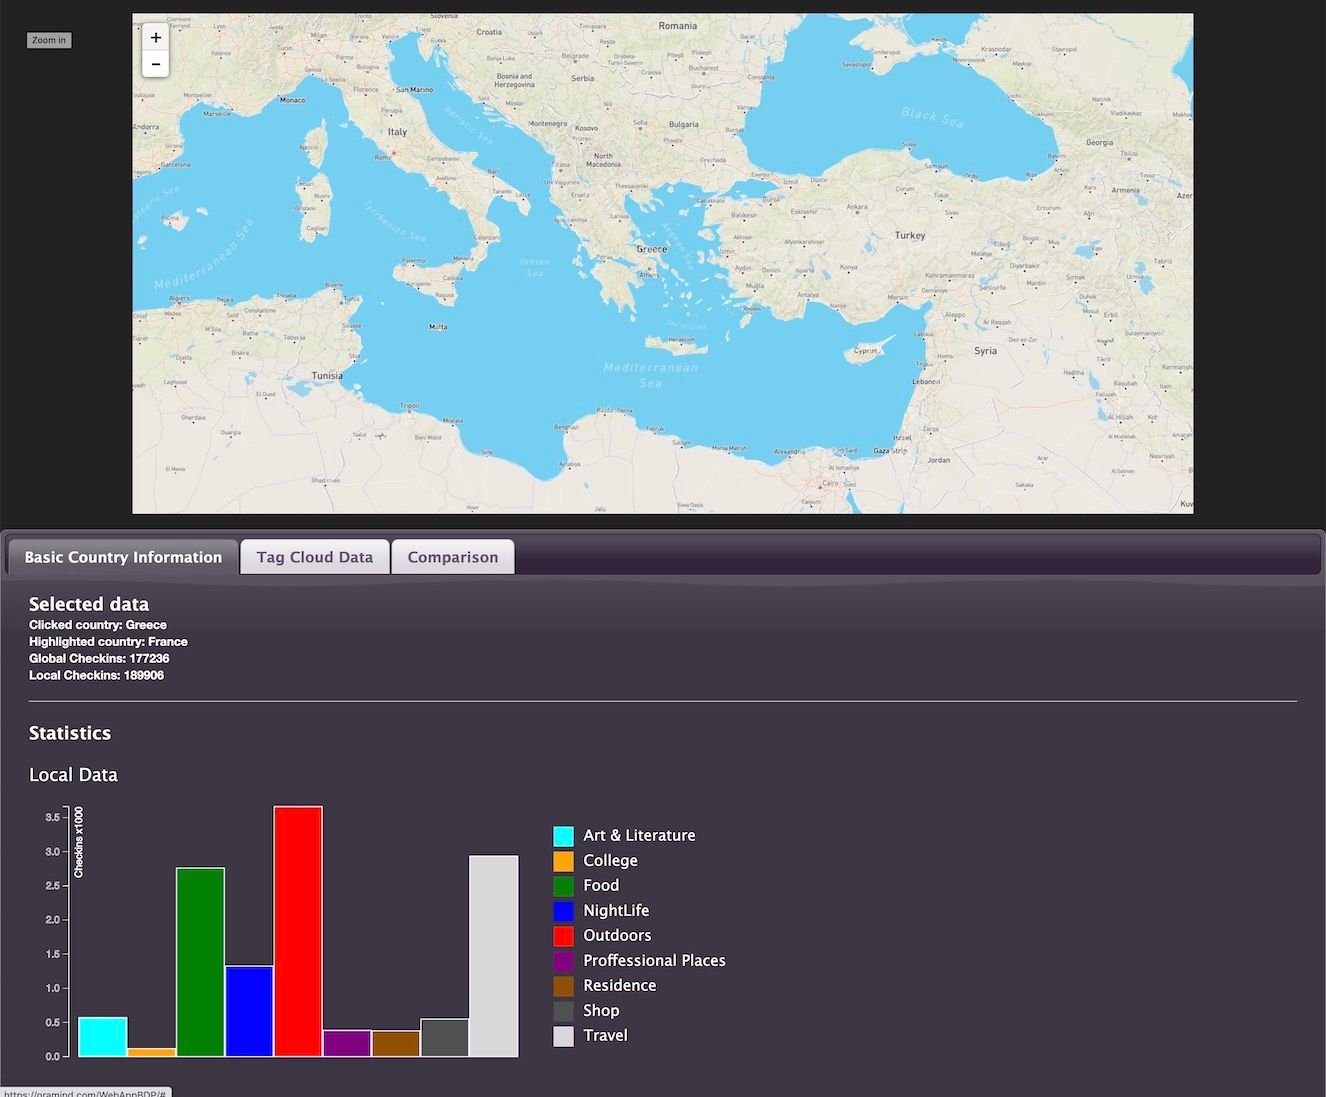
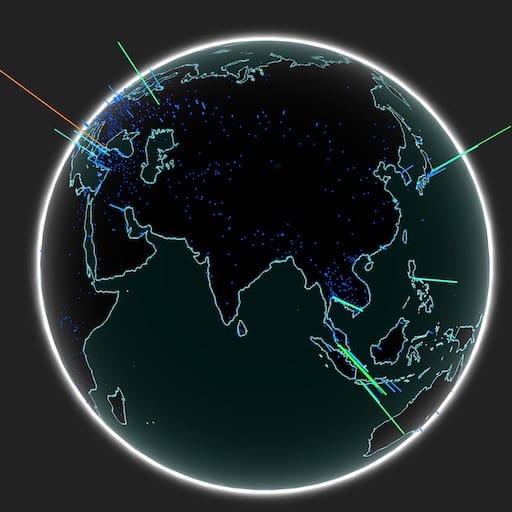
The data were grouped by check-in Venue Category, and I was able to visualise the data in order to allow a cultural comparison between countries, using LeafletJS, ThreeJS, WebGL and jQuery to draw the data using a browser environment.
All data had to be transformed, prepared and aggregated. To develop the map implementation I had to post-process polygon data, and translate them into Leaflet Layers to draw the polygons of the countries on the map.
You can see a Live Demo here: